From the Scripps institute https://keelingcurve.ucsd.edu/ – plan to update monthly


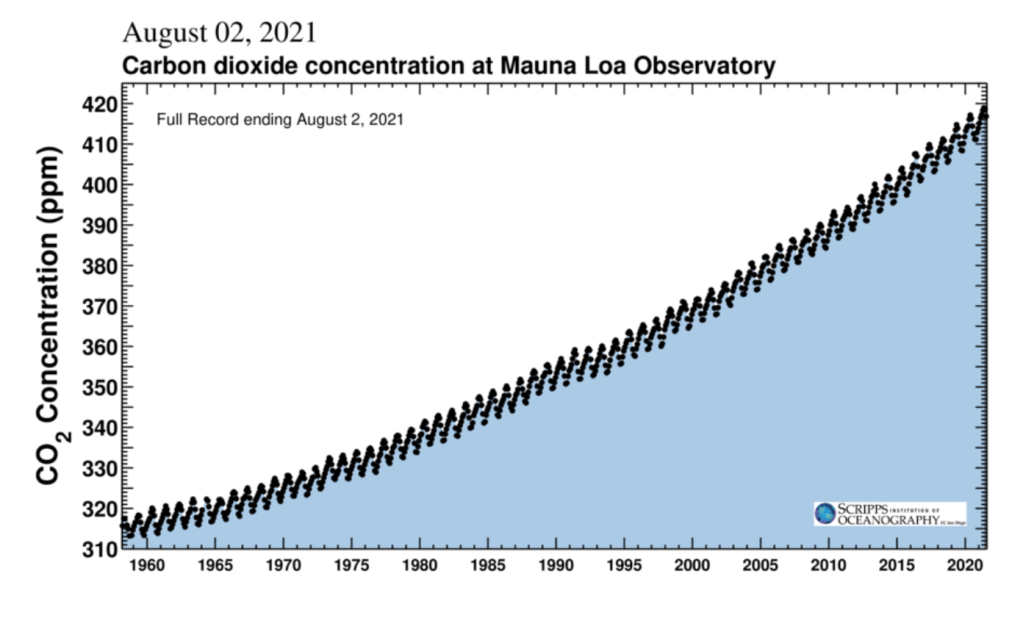
Classic Keeling curve from 1960

Two year curve shows annual variation and steady increase – note slight COVID glitch Mar 2020


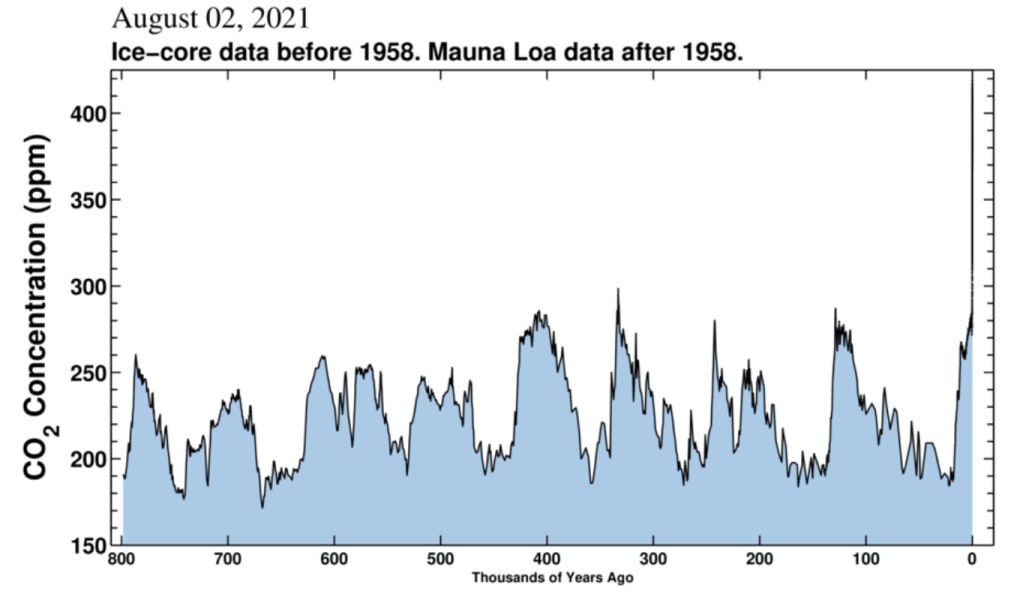
800,000 years showing the past natural cycles and the current extreme rise – vertical line at the right

Leave a Reply

Fill in your details below or click an icon to log in:

WordPress.com Logo

You are commenting using your WordPress.com account. Log Out /  Change )

Twitter picture

You are commenting using your Twitter account. Log Out /  Change )

Facebook photo

You are commenting using your Facebook account. Log Out /  Change )

Connecting to %s